Amplitude Detection
Amplitude detection is inferior to Phase Detection and Frequency Modulation methods and is not recommended.
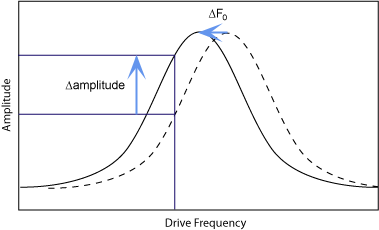
This section describes the differences in set up for amplitude detection. Changes in the cantilever amplitude provide an indirect measure of shifts in the cantilever resonance frequency:
Prior to initiating this procedure you must have completed the steps outlined in Basic EFM Operation.
- Set the to the left side of the cantilever resonance curve.
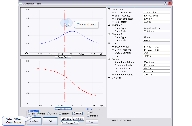
- With the Auto Tune function, NanoScope will automatically position the Drive Frequency to the right of the peak on the resonance curve, as shown above. For maximum sensitivity, set the Drive Frequency to the steepest part of the resonance curve. If you choose to modify the position of the Drive Frequency on the resonance curve, click the Manual Tune button or the Tune icon in the workflow toolbar to open the Cantilever Tune window:
(Hover over the image to view larger)
- To modify the Drive Frequency:
- Enable the Offset Cursor Mode.
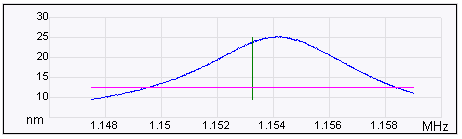
- Click the Drive Frequency marker line (green) and drag it to the new location on the resonance curve.
NOTE: As the tip oscillates above the sample, a gradient in the electric force shifts the resonance frequency F0. Tracking the variations in oscillation amplitude while in LiftMode yields an image of the electric force gradients. You may use either side of the resonance, though we have obtained slightly better results on the low side, as shown above.
 Related Topics
| www.bruker.com
|
Bruker Corporation |
| www.brukerafmprobes.com
|
112 Robin Hill Rd. |
| nanoscaleworld.bruker-axs.com/nanoscaleworld/
|
Santa Barbara, CA 93117 |
| |
|
| |
Customer Support: (800) 873-9750 |
| |
Copyright 2010, 2011. All Rights Reserved. |
Open topic with navigation
 to the left side of the cantilever resonance curve.